July 23, 2024
Performance Benchmarks: Comparing Query Latency across TypeScript ORMs & Databases

We have created open-source performance benchmarks to compare query latencies for Prisma ORM, TypeORM and Drizzle ORM with different database providers such as PostgreSQL on AWS RDS, Supabase and Neon. Read on to learn about our methodology and which TypeScript ORM is the fastest.
Contents
- TLDR
- Our benchmarking methodology
- Which ORM is the fastest?
- Improve the performance of your Prisma ORM queries
- Check out the benchmark results
TLDR
Selecting the best ORM for your application involves considering several factors, with query performance being a significant one.
To assist you in deciding which ORM to use for your TypeScript app, we have created open-source performance benchmarks comparing the query performance of three ORM libraries: Prisma ORM, TypeORM, and Drizzle ORM (using their Query API).
View benchmark results
So, which ORM is the fastest? The (maybe unsatisfying) answer: It depends!
Based on the data we've collected, it's not possible to conclude that one ORM always performs better than the other. Instead, it depends on the respective query, dataset, schema, and the infrastructure on which the query is executed.
Check out our performance checklist below to ensure optimal performance for your Prisma ORM queries.
Our benchmarking methodology
Measuring and comparing query performance can be a daunting task and there's a lot of factors to consider for creating a fair comparison.
With our benchmarks, we wanted to strike a balance between ensuring that the benchmarks are fair and meaningful to help people make an informed decision on which ORM to use for their next project while keeping things simple and easy to understand without too many layers of indirection or data processing.
You can find the application that we used to measure query performance here.
Setup
We have created 14 equivalent queries for Prisma ORM, TypeORM and Drizzle ORM. The queries are sent against a schema with 4 Prisma models (5 tables because of one implicit m-n relation which uses an additional relation table under the hood).
The query latency for each query is measured via performance.now() using this function:
For example, the plain findMany query from Prisma ORM can be measured as follows:
There is one script per ORM per database (e.g. prisma-postgres.ts) that measures the latencies of all 14 queries individually and stores the results in .csv files.
The scripts have been executed on an EC2 instance against PostgreSQL database hosted on various providers:
![]()
A database connection is established at the beginning of each script and closed at the end.
Data preparation
The sample data is seeded using faker.js. To re-create identical sample datasets in a deterministic fashion, a seed value is provided to the faker instance.
The size of the dataset is configurable when running the benchmarks. It determines how many records are created per table. For example, if a dataset of size 1000 is created, there will be 1k records in the Customer, Product and Address tables and 10k records in the Order table (the Order table is multiplied with a factor of 10 because of its many-to-many relation with Product making the dataset more realistic).
Benchmark execution
To execute the benchmarks, you can invoke the script as follows:
This executes the pre-defined queries 500 times against a data set of 1000 records per table. The database URL can alternatively be provisioned as an environment variable.
To collect our data, we have executed the benchmarks on production infrastructure to simulate a real-world usage scenario. The scripts have been executed from an EC2 instance with this spec:
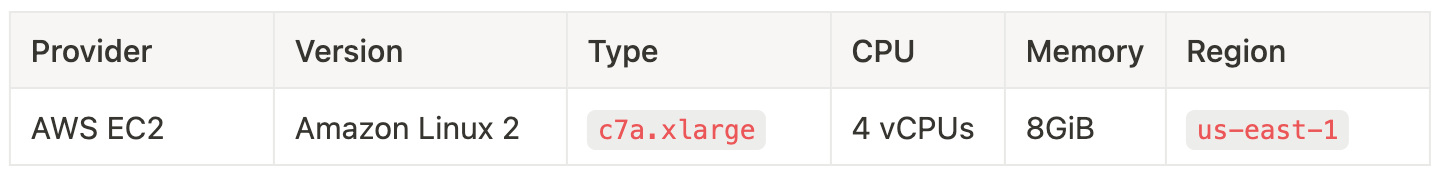
The databases we used have the following spec:

Publishing benchmark results
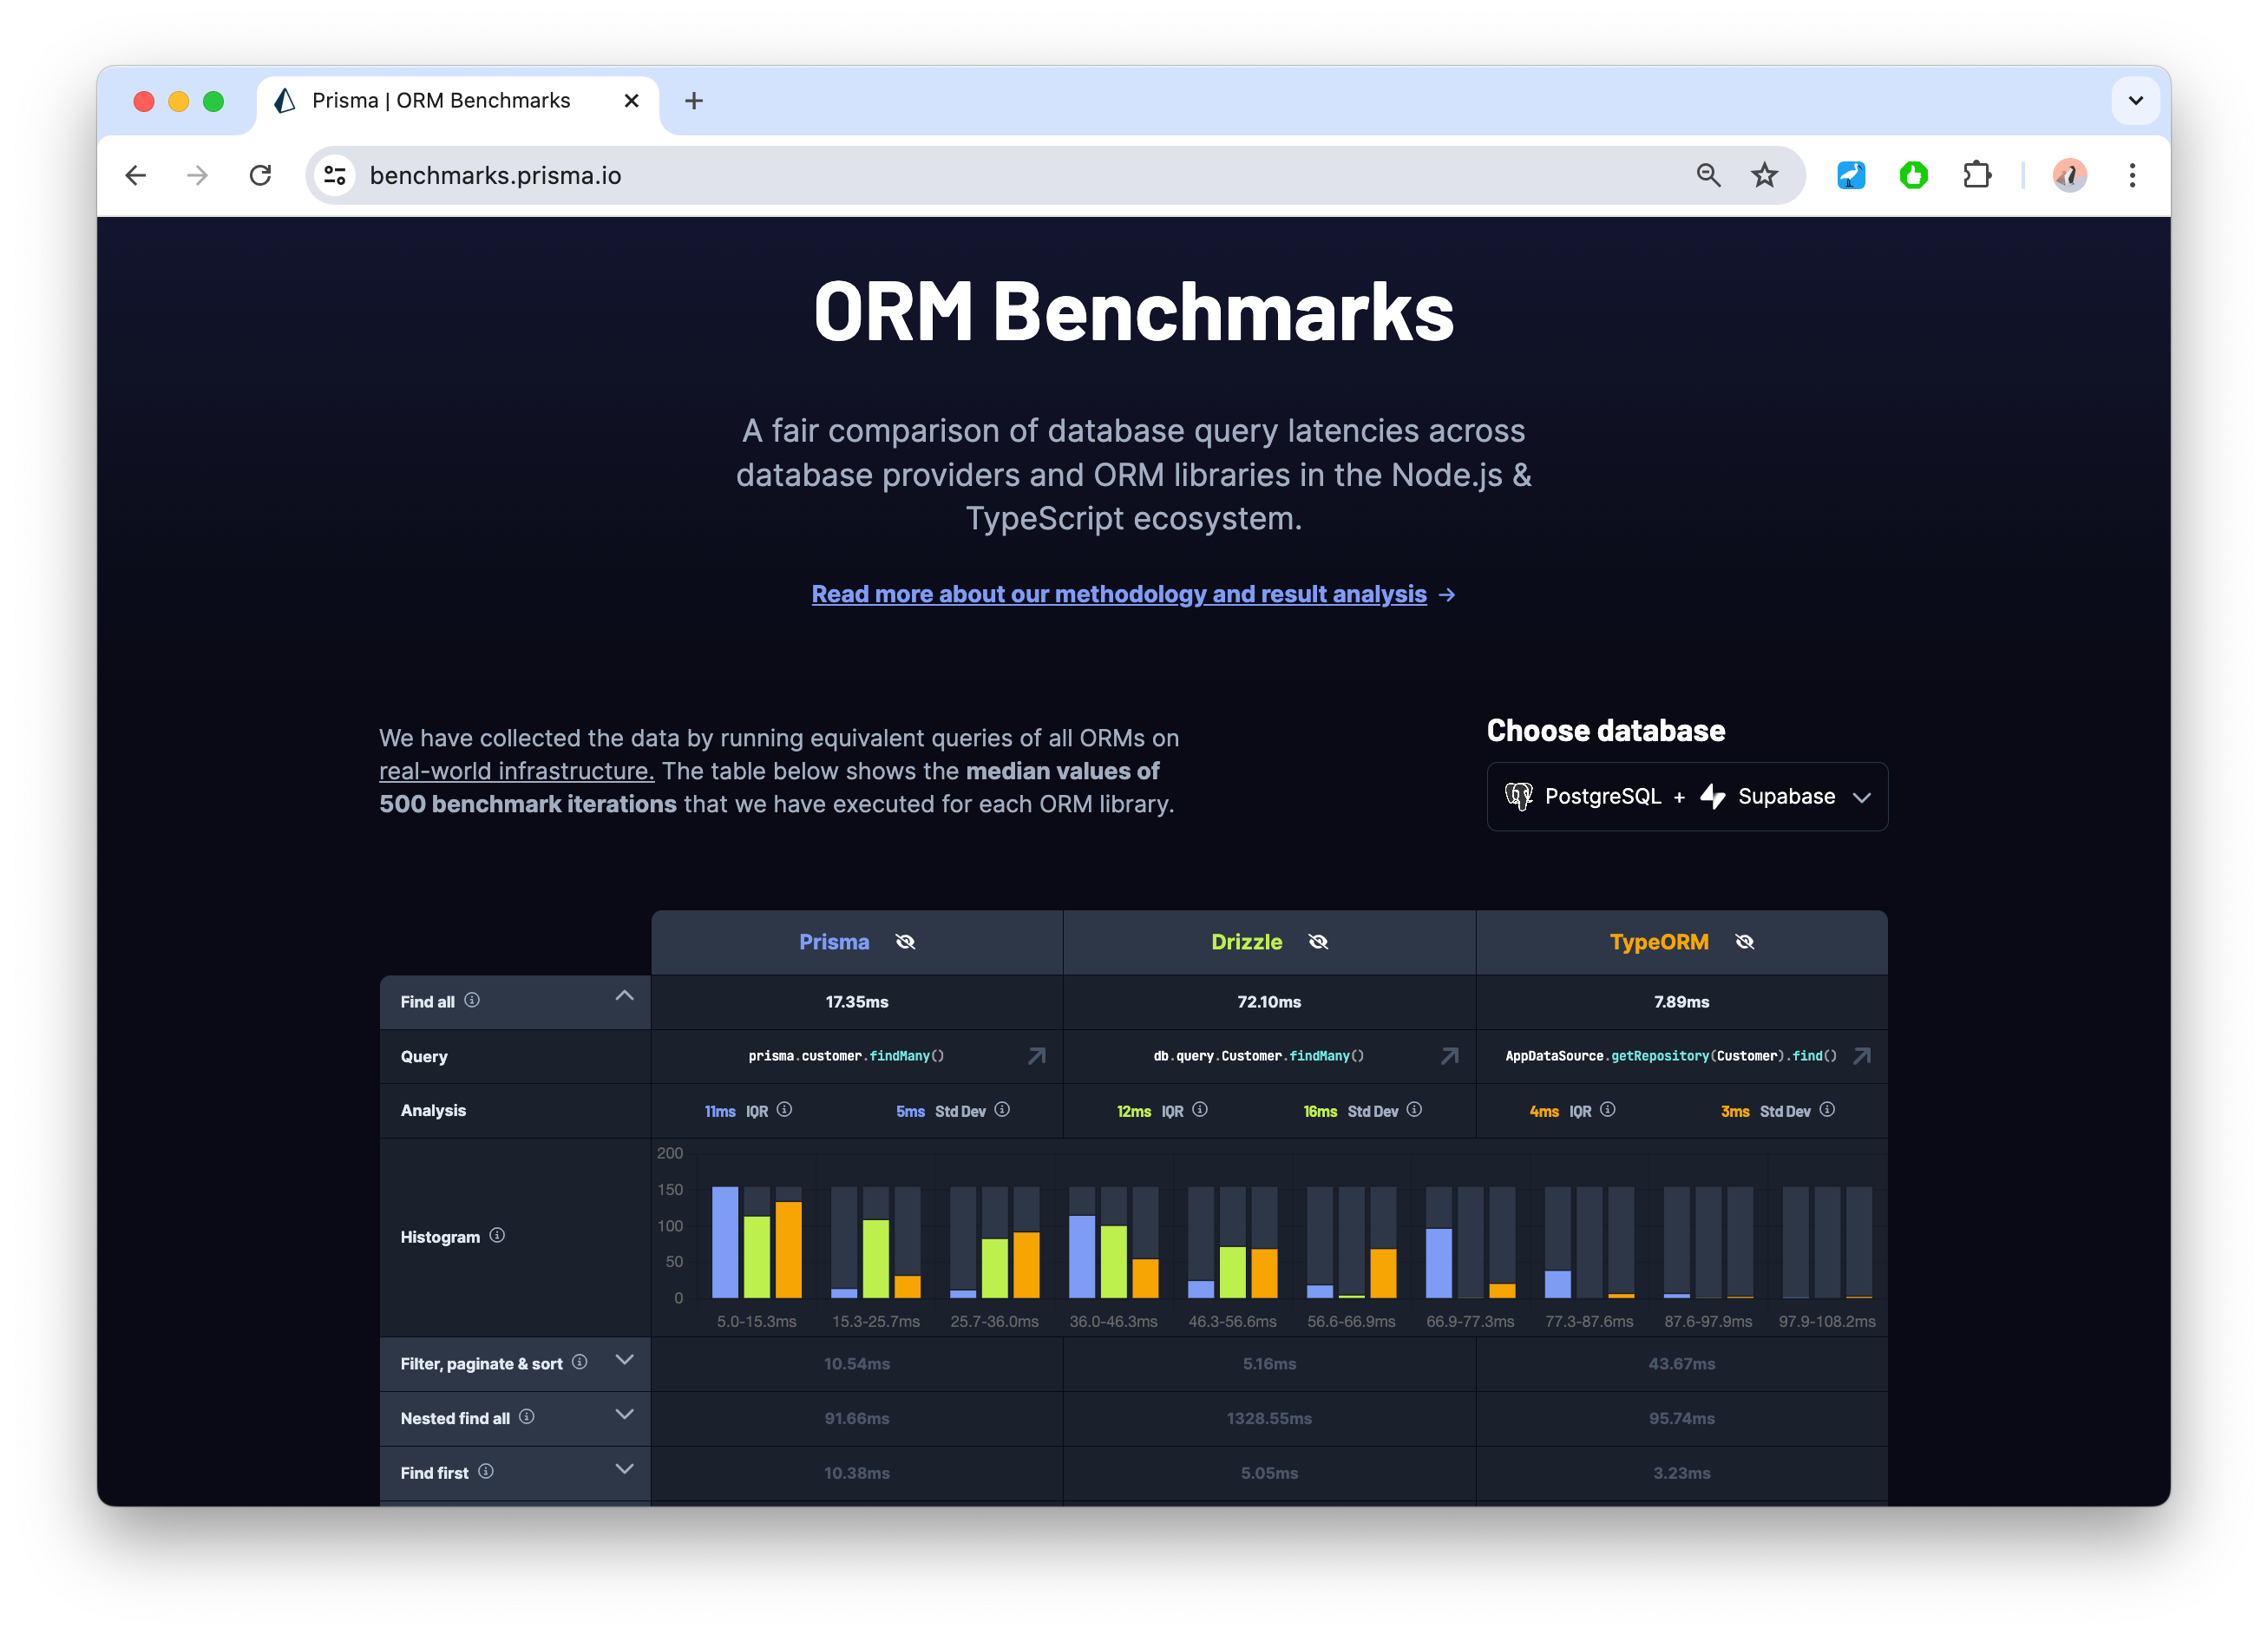
We have published the results of the benchmarking runs we have executed on: https://benchmarks.prisma.io.
The table displays the median values of the 500 iterations we have executed to measure query latencies. Note that we have discarded outliers from the 500 iterations by removing values above the 99th percentile (p99).
The columns of the table represent the three ORM libraries, the rows show the queries that have been benchmarked.
When expanding a cell, you can view some details about the query, such as:
- The actual code snippet with the query that produced the result.
- A histogram that visualizes the distribution of the collected data. In these charts, higher bars on the left are better because they indicate that more iterations had lower latencies.
Caveats
Benchmarks are an inherently tricky topic and difficult to get right. When companies publish performance benchmarks, these will typically show that their products are the fastest in the market while making it difficult for other people to reproduce the results and obscuring the path from raw data collection to result presentation.
We did our best to create a fair and neutral setup that's easy to understand and produces meaningful results. With that said, here are some caveats to take into account when looking at the benchmark results:
- TypeORM and Drizzle ORM are more limited in their APIs and some Prisma ORM queries (like a nested create) can't be expressed with their higher-level abstraction. In these cases, we're dropping down to using their SQL query builders.
- There is an expected variation in the results across iterations due to network latency. In order to reduce the impact of that, we have executed the benchmarks 500 times and are showing the results using the median and a histogram in the published benchmark results.
- We have further made sure that the machine from which the queries are executed is located in the same region as the database that's accessed to keep the network latency minimal.
- In our benchmarks, we haven't done any mitigation to reduce the impact of the DB-level or the OS-level caches.
- All benchmark iterations use the default connection pool sizes of the respective ORM / driver library.
- While we strived for making the benchmark setup as realistic as possible, we had to take some tradeoffs in schema and queries. For example, we didn't add special indexes to the schema and sometimes used intentionally simplistic queries to be able to properly compare the higher-level APIs of each ORM.
We have put a lot of effort into making it easy to run the benchmarks yourself, so give it a shot, and if you would like to contribute an improvement, feel free to reach out!
Which ORM is the fastest?
As unsatisfying as it may be, the answer is as so often: It depends. Performance is a complex and nuanced topic that depends on a variety of factors and is notoriously hard to predict.
See the performance checklist below to make sure your queries are at optimal speed.
While it's not possible to provide a conclusive answer to that question, we can try to look at the some patterns and analyze them.
Low variance across database providers
First off, we found that the difference across DB providers generally seems to be negligible. For example, just looking at the plain findMany query, we can see in the median values and the histogram distribution, that performance has low variances:
| Prisma ORM | Drizzle ORM | TypeORM | |
|---|---|---|---|
| Supabase | 8.00ms | 23.09ms | 5.24ms |
| AWS RDS | 6.59ms | 19.19ms | 4.20ms |
| Neon | 11.43ms | 29.35ms | 7.25ms |
Presumably RDS has a an advantage because the benchmark scripts have been executed from an EC2 instance within the same security group while the Supabase and Neon DBs are accessible via the public internet.
For more information, be sure to visit the benchmark site to inspect our results or run the benchmark results yourself using the database provider of your choice.
Most queries are in similar performance ballparks
If you zoom out and look at the results from a distance, you'll notice that most queries actually perform in similar ballparks with only a few milliseconds difference. As an example, here are the results we've collected on AWS RDS:

UX research shows that delays below the 100ms mark are imperceptible by users and still make a system feel instantaneous, so in most cases these small differences probably shouldn't be a driving factor in your choice of which ORM to use for the next project.
Of course, the database query latency is only one factor in the overall performance of the app you're building, so be sure to measure and optimize the other aspects as well, especially all the network boundaries your system has (such as an HTTP layer).
The main outlier: Nested find all
The Nested find all query has been especially slow with all ORMs and all database providers. It's a simple query that looks like this:
Prisma ORM
Drizzle ORM
TypeORM
Taking RDS as an example, these are the median values in the results we've collected:
| Prisma ORM | Drizzle ORM | TypeORM | |
|---|---|---|---|
| Nested find all | 62.4ms | 948.29ms | 56.34ms |
This query has shown to be a lot slower for all ORMs than the other queries because it fetches data from two separate tables and the amount of data that's returned is notable.
Conclusion
The data we've collected doesn't allow for conclusive statements about the individual performance of each ORM. The hard truth about query performance is that it's possible to write fast as well as slow queries with each ORM library.
In the end, much of an application's performance depends on the developer's ability to follow best practices (see the performance checklist below), identify slow queries, and optimize them over time.
Improve the performance of your Prisma ORM queries
Performance plays a crucial role for us at Prisma and we have focused a lot recently on improving various aspects of Prisma ORM in that area, e.g. by introducing the option to use DB-level JOINs, implementing many performance improvements in v5, improving serverless cold starts by 9x or increasing the speed of $queryRaw by 2x in the last 5.17.0 release.
Performance checklist for Prisma ORM
Here's a basic checklist that helps you ensure that your Prisma ORM queries are at optimal performance:
- Host server and database in the same region.
- Add indexes to columns that are frequently used in your queries.
- Make sure to have least 3 CPU cores available in production environments.
- Measure performance and optimize a query with raw SQL when needed.
- Monitor your queries using the OpenTelemetry tracing and metrics features of Prisma ORM.
- Add a caching layer to your DB (e.g. Prisma Accelerate).
- If your app is serverless, follow the best practices for serverless performance.
If you follow these recommendations but are still seeing slow queries, please open an issue on GitHub with details about your query so that we can make sure it's as fast as it should be!
Insights and recommendations with Prisma Optimize
To support you in measuring performance and making your Prisma ORM queries faster, we have recently launched Prisma Optimize.
Optimize captures all queries that are sent to your DB via Prisma ORM and gives you insights into their performance with detailed tracing information. In the future, Optimize will be able to give you recommendations for speeding up slow queries, e.g. by recommending when an excessive number of rows returned or where to define an index in your schema.
Check out the benchmark results
You can find the results of our benchmark run on https://benchmarks.prisma.io. Check them out and let us know what you think on X and Discord. We're especially keen on hearing on how we can make this benchmark even more helpful to you and welcome suggestions for improvement!
Don’t miss the next post!
Sign up for the Prisma Newsletter