September 09, 2024
Improve your application’s performance with AI-driven analysis and recommendations
Prisma Optimize is now generally available. Use it to streamline query analysis, generate actionable insights, and improve database performance by using recommendations to identify and optimize problematic queries.

Query performance: Now simple enough to improve on your lunch break
You’ve built an app that runs perfectly during development, but once it goes live, things slow down. Pages lag, specific queries drag, and identifying the root cause feels like a guessing game. Is it an unindexed column? A query returning too much data? Manually combing through logs can take hours, especially without the right tools to spot the issue.
How Prisma Optimize solves this: Prisma Optimize takes the guesswork out of query troubleshooting. It automatically identifies problematic queries, highlights performance bottlenecks, and provides actionable recommendations. You can also track the impact of optimizations in real-time, allowing you to focus on building your app while Prisma Optimize helps you fine-tune performance.
Streamlined query insights and optimization
Fast database queries are critical for app performance, but tracking down slow queries and fixing them can be complex. Prisma Optimize simplifies this process by:
- Automatically surfacing problematic queries.
- Offering key performance metrics and targeted improvement suggestions.
- Providing insights into raw queries for deeper analysis.
With Prisma Optimize, you can optimize your database without needing complex setups or additional infrastructure.
Get performance metrics and see the raw query
Prisma Optimize lets you create recordings from app runs and view query latencies:

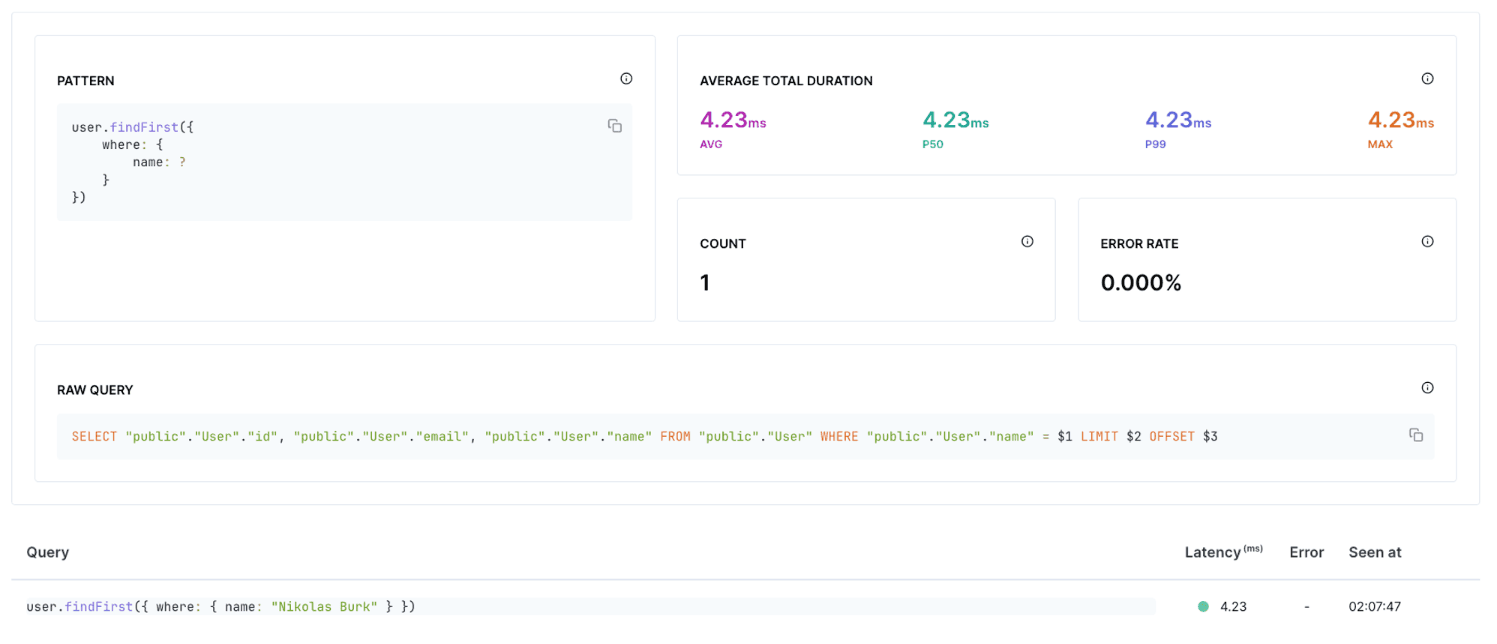
You can also click on a specific query to view the generated raw query, identify errors, and access more comprehensive performance insights:

Expert recommendations to improve your queries
Prisma Optimize provides actionable recommendations to enhance query performance, saving you hours of manual troubleshooting. Current recommendations include (and more on the way):
- Excessive number of rows returned: Reduces load by limiting unnecessary data retrieval.
- Query filtering on an unindexed column: Identifies where indexing will improve performance.
- Full table scans caused by
LIKEoperations: Suggests more efficient alternatives when inefficient operators are detected in queries.
You can compare query latencies across different recordings to evaluate performance improvements after applying these recommendations:

Interacting with Prisma AI for further insights from each recommendation
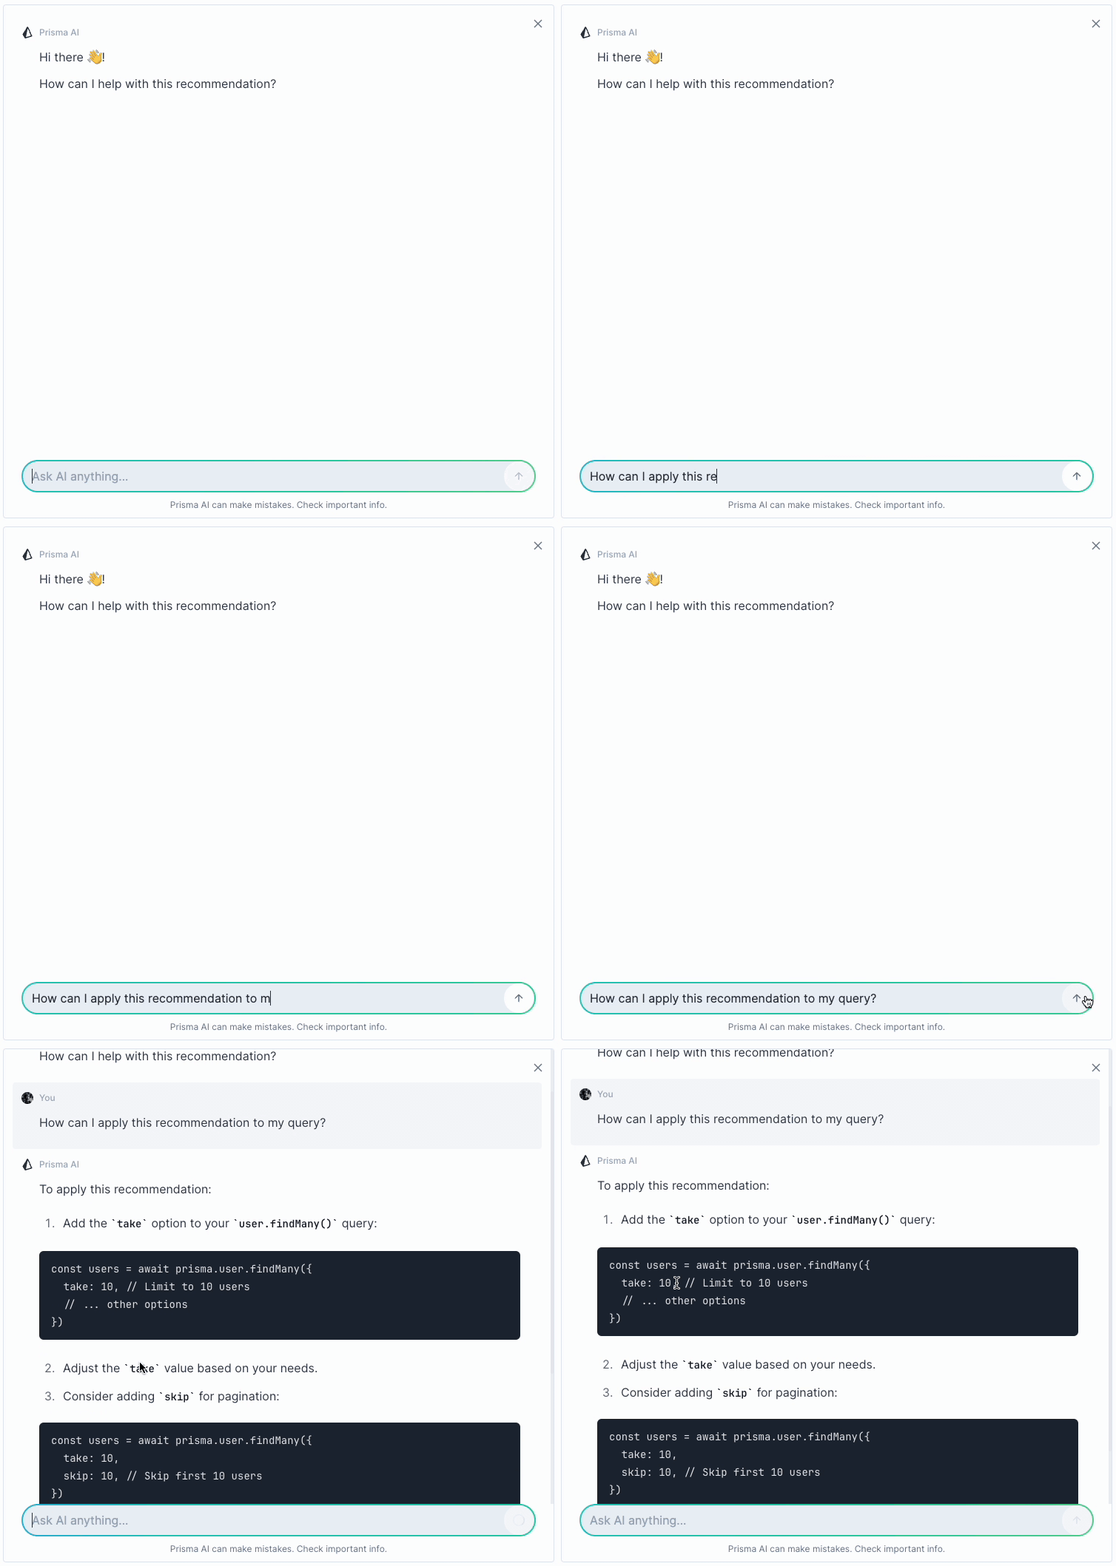
Click the Ask AI button in any recommendation to interact with Prisma AI and gain additional insights specific to the provided recommendation:

Try out the example apps
Explore our example apps in the Prisma repository to follow along and optimize query performance using Prisma Optimize:
starteroptimize-excessive-rowsoptimize-full-table-scanLIKE operations" recommendation provided by Optimize.optimize-unindexed-columnStart optimizing your queries
Get started with Prisma Optimize today and see the improvements it brings to your query performance. Stay updated with the latest from Prisma via X or our changelog. Reach out to our Discord if you need support.
Get started with Prisma Optimize
Read the docs
Don’t miss the next post!
Sign up for the Prisma Newsletter